REDIS 集群模式监控redis
部署
| 主机 | 端口 | 角色 |
|---|---|---|
| 192.168.116.156 | 7000 | master |
| 192.168.116.156 | 7001 | slave |
| 192.168.116.157 | 7000 | master |
| 192.168.116.157 | 7001 | slave |
| 192.168.116.158 | 7000 | master |
| 192.168.116.158 | 7001 | slave |
三台主机安装 Redis
bash
sudo apt-get install lsb-release curl gpg
curl -fsSL https://packages.redis.io/gpg | sudo gpg --dearmor -o /usr/share/keyrings/redis-archive-keyring.gpg
sudo chmod 644 /usr/share/keyrings/redis-archive-keyring.gpg
echo "deb [signed-by=/usr/share/keyrings/redis-archive-keyring.gpg] https://packages.redis.io/deb $(lsb_release -cs) main" | sudo tee /etc/apt/sources.list.d/redis.list
sudo apt-get update
sudo apt-get install redis
创建配置
bash
mkdir cluster-test
cd cluster-test
mkdir 7000 7001
写入配置文件
bash
cat > 7000/redis.conf <<EOF
port 7000
cluster-enabled yes
cluster-config-file nodes.conf
cluster-node-timeout 5000
appendonly yes
protected-mode no
EOF

cat > 7001/redis.conf <<EOF
port 7001
cluster-enabled yes
cluster-node-timeout 5000
appendonly yes
protected-mode no
EOF
创建集群
bash
redis-cli --cluster create 192.168.116.156:7000 192.168.116.156:7001 \
  192.168.116.157:7000 192.168.116.157:7001 \
  192.168.116.158:7000 192.168.116.158:7001 \
  --cluster-replicas 1
Redis 监控要点
延时
响应延时
bash
redis-cli --latency -c -p 7000慢日志
bash
# 查看慢日志阈值
 CONFIG GET slowlog-log-slower-than

 # 查看最近10条慢日志
 SLOWLOG GET 10
流量
bash
# 每秒执行多少次操作
# 每秒接收多少 KiB
# 每秒返回多少 KiB
# keyspace_hits
# keyspace_misses
info all
错误 Redis 错误比较少见
饱和度
bash
# 查看内存相关指标
info memory- 内存使用率
- 内存碎片率,used_memory_rss 除以 used_memory 就是内存碎片率。
- evicted_keys 指标,当内存占用超过了 maxmemory 的时 候,Redis 清理的 Key 的数量。
Zabbix
Redis 集群模式运行再不同的节点上,每个节点都需要安装zabbix agent进行监控。
三台主机安装zabbix-agent2
bash
sudo wget https://repo.zabbix.com/zabbix/6.4/ubuntu/pool/main/z/zabbix-release/zabbix-release_latest+ubuntu22.04_all.deb
sudo dpkg -i zabbix-release_latest+ubuntu22.04_all.deb
sudo apt update
sudo apt install -y zabbix-agent2
修改配置文件
bash
sudo vim /etc/zabbix/zabbix_agent2.conf

Server=192.168.116.128
ServerActive=192.168.116.128
Hostname=192.168.116.158  #节点IP

sudo systemctl restart zabbix-agent2.service
zabbix 前端配置Redis监控
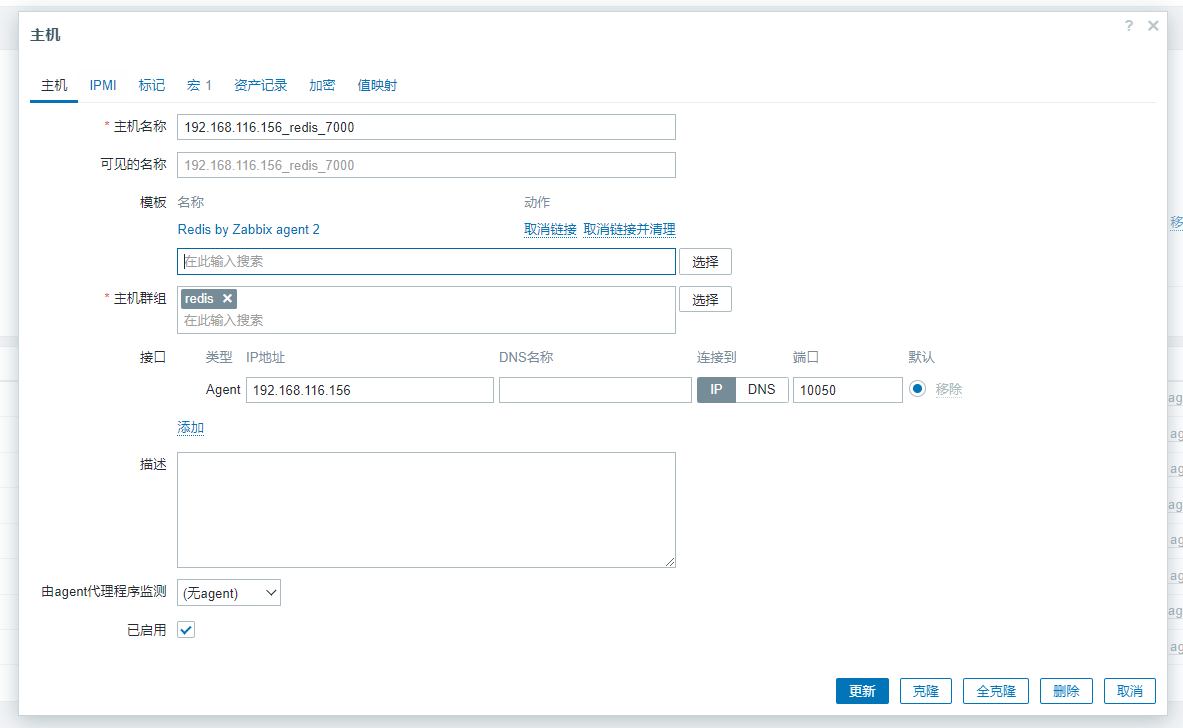
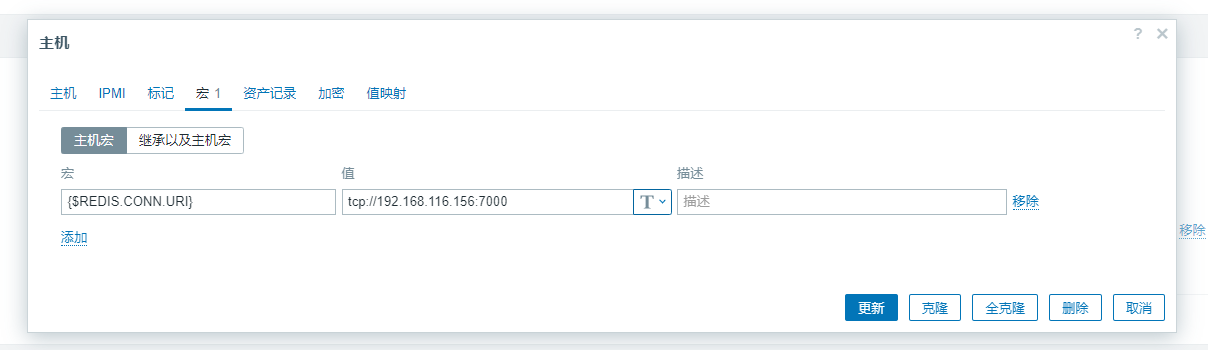
根据端口不通修改配置
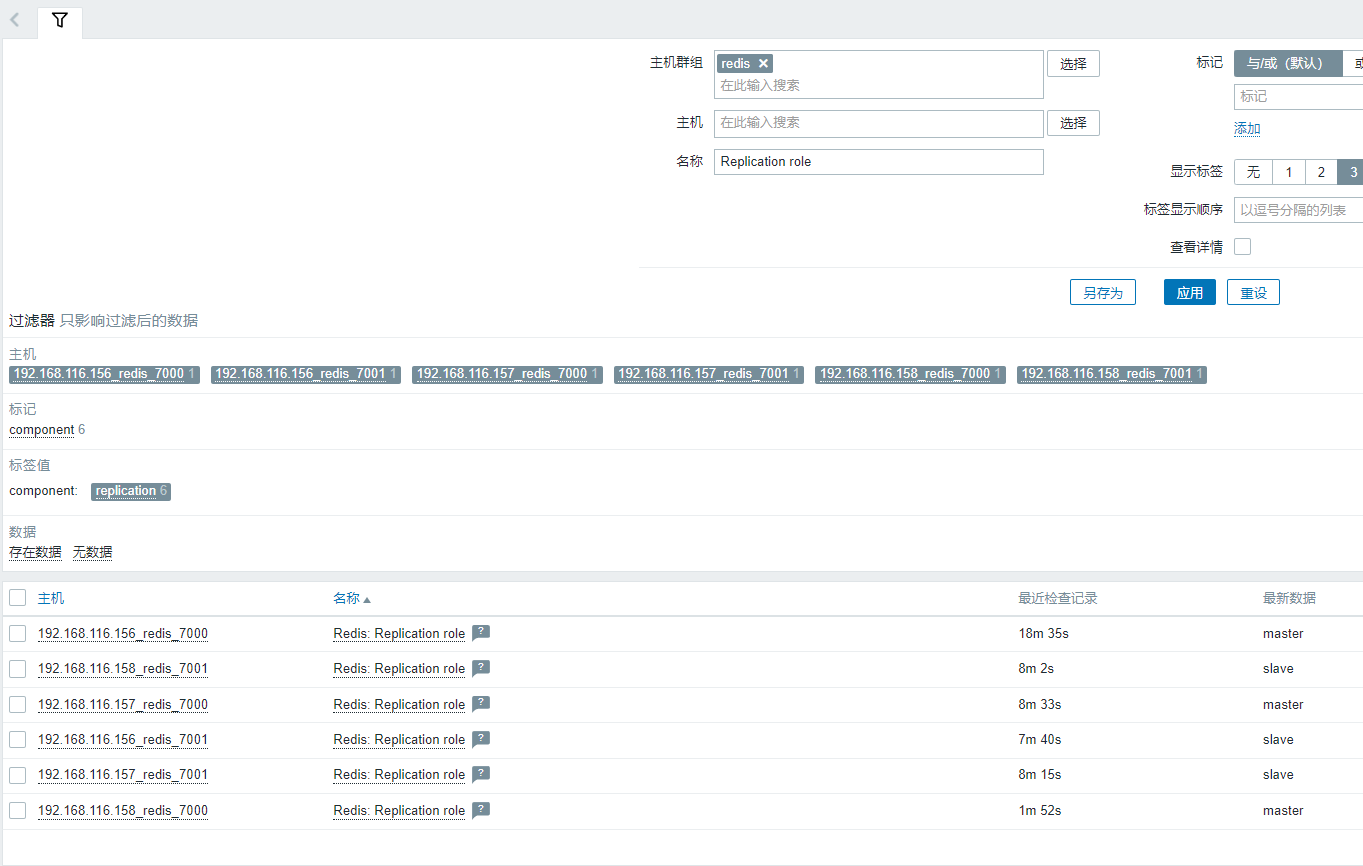
查看节点数据和角色
Prometheus
安装 redis_exporter 并启动
bash
wget https://github.com/oliver006/redis_exporter/releases/download/v1.66.0/redis_exporter-v1.66.0.linux-amd64.tar.gz
tar -zxvf redis_exporter-v1.66.0.linux-amd64.tar.gz
cd redis_exporter-v1.66.0.linux-amd64

./redis_exporter
修改 prometheus.yml 配置
bash
global:
  scrape_interval: 15s
  evaluation_interval: 15s

alerting:
  alertmanagers:
    - static_configs:
        - targets:
           - 192.168.116.128:9093

rule_files:
  - rules.yml
  - rules/*.yml


scrape_configs:
  ## config for the multiple Redis targets that the exporter will scrape
  - job_name: 'redis_exporter_targets'
    static_configs:
      - targets:
        - redis://192.168.116.156:7000
        - redis://192.168.116.156:7001
        - redis://192.168.116.157:7000
        - redis://192.168.116.157:7001
        - redis://192.168.116.158:7000
        - redis://192.168.116.158:7001
    metrics_path: /scrape
    relabel_configs:
      - source_labels: [__address__]
        target_label: __param_target
      - source_labels: [__param_target]
        target_label: instance
      - target_label: __address__
        replacement: 192.168.116.128:9121

  ## config for scraping the exporter itself
  - job_name: 'redis_exporter'
    static_configs:
      - targets:
        - 192.168.116.128:9121
重启 prometheus
bash
systemctl restart prometheus.service查看节点状态
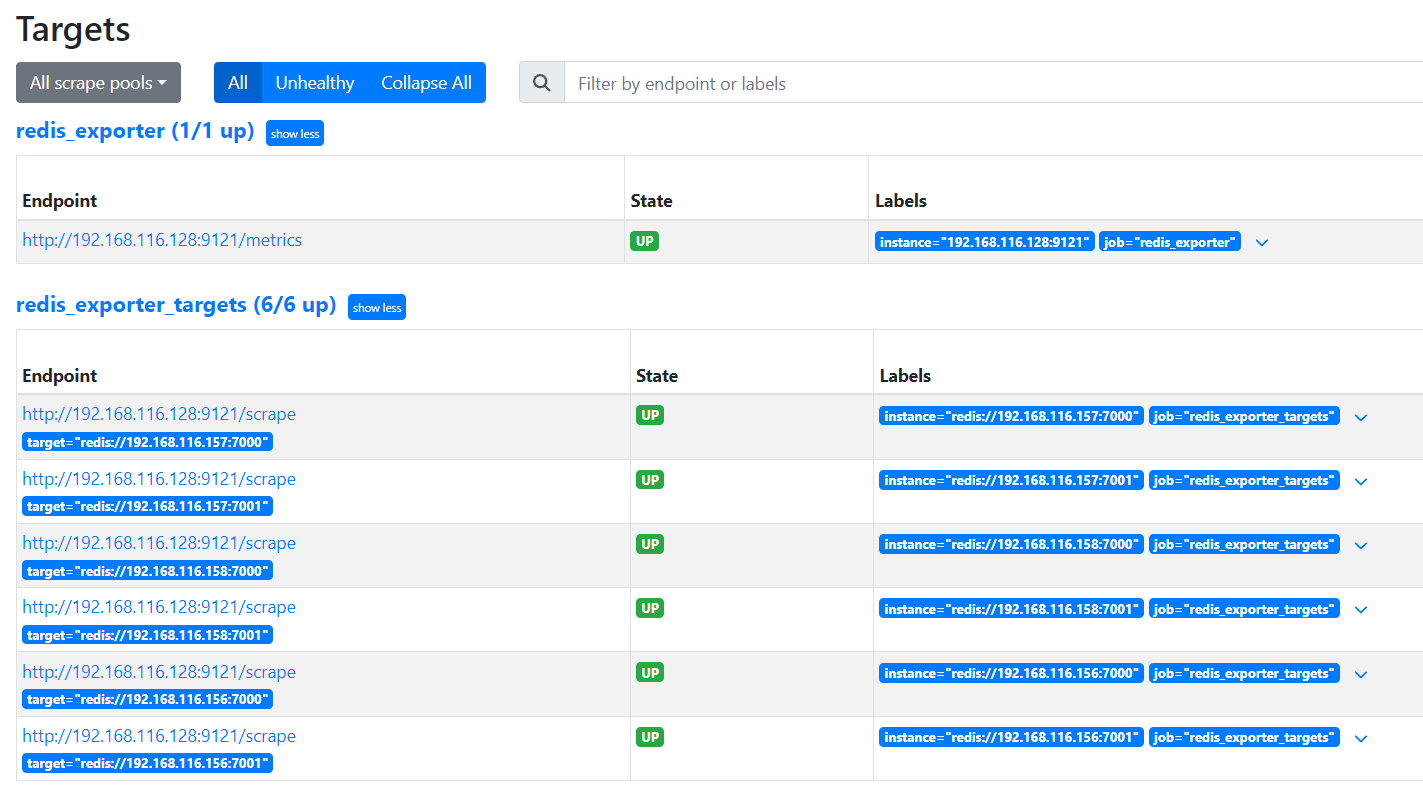
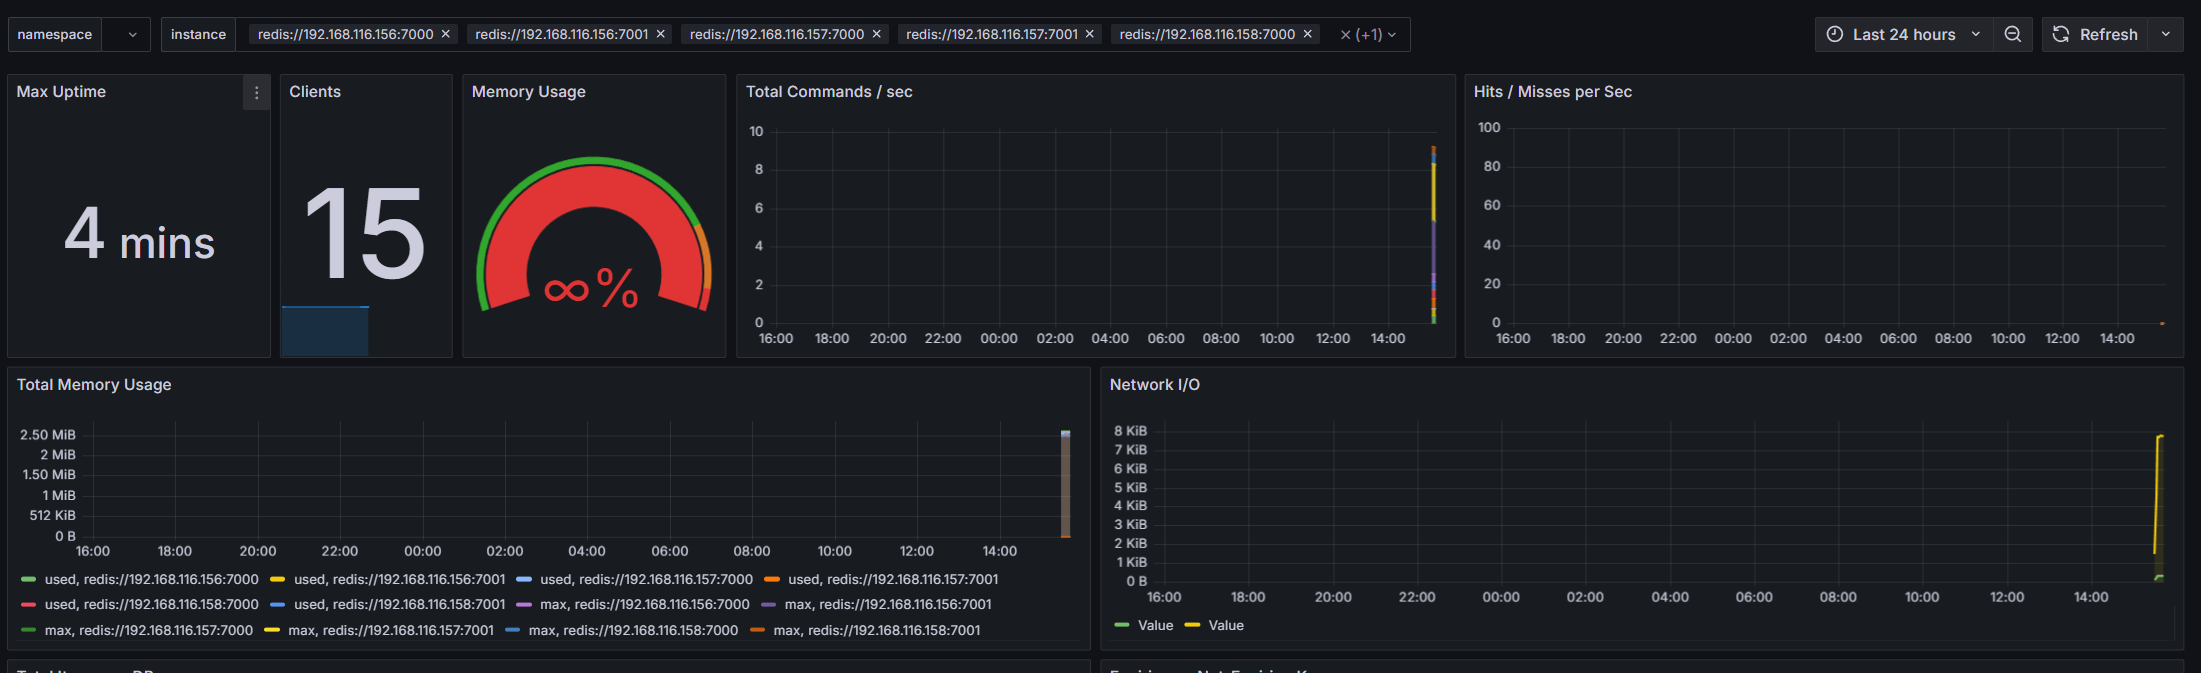
接入 grafana ID 763
配置 redis 告警
yaml
groups:
  - name: RedisInstanceDownAlert
    rules:
      - alert: RedisInstanceDown
        expr: redis_up{instance=~"redis://.*"} == 0
        for: 1m
        labels:
          severity: critical
        annotations:
          summary: "Redis {{ $labels.instance }}instance down"
          description: "Redis instance {{ $labels.instance }} is not reachable for more than 1 minute."
查看告警
